


Debugging Mods 26.1.2
Learn all about logging, breakpoints and other useful debugging features.
In programming, even the best are bound to encounter issues, bugs and mistakes.
This guide outlines some general steps that you can take to potentially identify and resolve those, even without the help of others. Solving problems on your own can teach you many things, and will also feel rewarding.
However, if you are stuck, unable to find fixes by yourself, there is no problem in asking others for help!
Console and LOGGER
The simplest and fastest way to locate problems is logging to the console.
Values can be printed there at runtime, informing the developer about the current state of the code, and making it easy to analyze changes and potential mistakes.
You can create a logger using the LoggerFactory, which takes in a name that will be shown in the log next to printed messages:
java
public static final Logger LOGGER = LoggerFactory.getLogger(MOD_ID);TIP
The initializer generated by the mod template provides a default logger using your mod id.
Whenever you need to know a value for something at any point in the code, use this LOGGER by passing a String to its methods.
java
ExampleMod.LOGGER.info("You interacted with an entity!");The logger supports multiple modes of printing text to the console. Depending on which mode you use, the logged line will be displayed in different colors.
java
ExampleMod.LOGGER.debug("Debug message for development...");
ExampleMod.LOGGER.info("Neutral, informative text...");
ExampleMod.LOGGER.warn("Non-critical issues...");
ExampleMod.LOGGER.error("Critical exceptions, bugs..."); INFO
All logger modes support multiple overloads; this way you can provide more information like a stack trace!
For example, let's make sure that, when the TestItem is used on an entity, it will output its current state in console.
java
@Override
public InteractionResult interactLivingEntity(ItemStack stack, Player user, LivingEntity entity, InteractionHand hand) {
	Level level = user.level();

	// Extra parameters will be interpolated into the format string
	ExampleMod.LOGGER.info(
			"Is Client World: {} | Health: {} / {} | The item was used with the {}",
			level.isClientSide(), entity.getHealth(), entity.getMaxHealth(), hand
	);

	if (!level.isClientSide()) {
		// you can log non-critical issues differently as a warning
		ExampleMod.LOGGER.warn("Don't touch that!");

		// The LOGGER can print the Stacktrace too in addition to the logging message
		if (stack.getCount() > 1) {
			IllegalArgumentException exception = new IllegalArgumentException("Only one item is allowed");
			ExampleMod.LOGGER.error("Error while interacting with an entity", exception);
			throw exception;
		}
	}

	return InteractionResult.SUCCESS;
}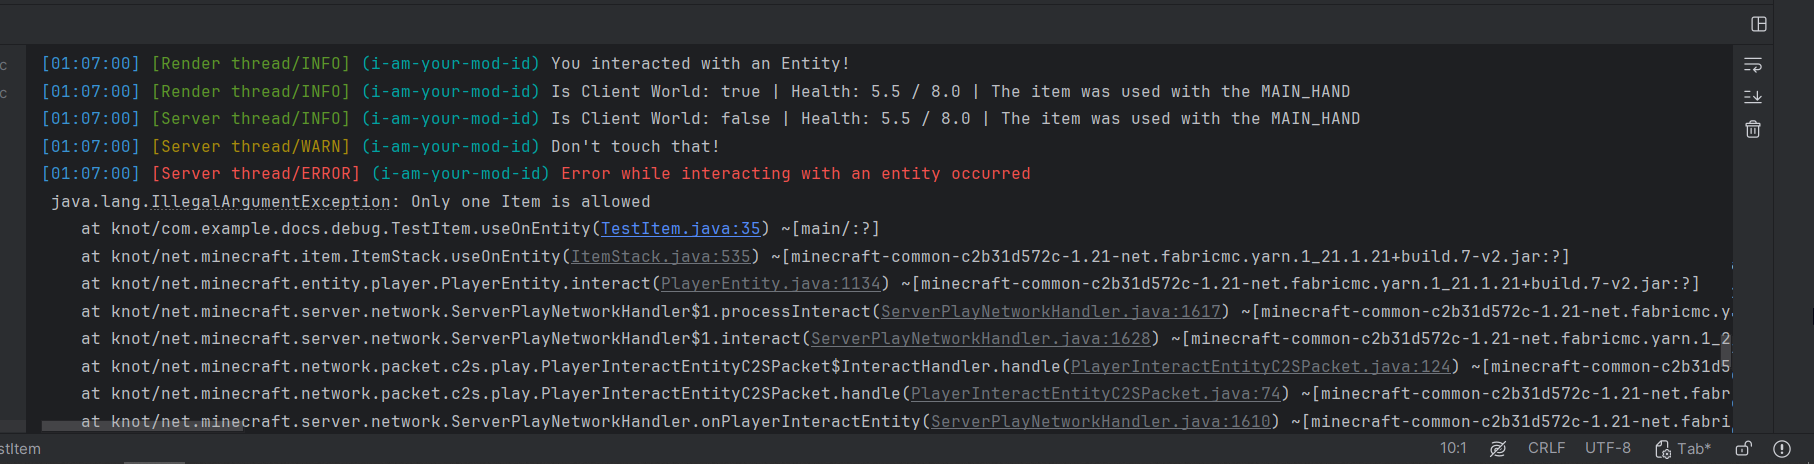
In the logged line, you can find:
Time- The time when the logged information was printedThread- The thread in which it was printed. You will often see a server thread and a render thread; this tells you on which side the code had been executedName- The name of the logger. It is best practice to use your mod id here, so that logs and crashes show which mod loggedMessage- This should be concise but descriptive. Include relevant values or contextStack Trace- If provided with an exception's stack trace, the logger can print that too
Keeping The Console Clean
Keep in mind that all of these will also be printed if the mod is used in any other environment.
To prevent your mod from polluting the log files, choose a fitting log level for your logs. If the data you are logging is only relevant during development, it is highly recommended to use the debug level.
WARNING
The debug level is hidden by default, to show it during development see Debug Logging .
If you are still unsure which log level to choose, a good rule of thumb is to only use non-debug levels if something went wrong. Modpack devs and users don't care too much about, for example, items initializing; they would rather know if, for example, a datapack failed to load correctly.
Debug Logging
The debug log level is hidden by default, but can be specifically enabled in the development environment using some configuration.
To do this, create the log4j-dev.xml configuration file in your project's root directory, and add the following contents. Make sure to replace the value inside the name attribute with your mod's modid. This configuration allows debug logs from your mod to be shown in the console.
xml
<?xml version="1.0" encoding="UTF-8"?>
<Configuration>
  <Loggers>
    <Logger name="example-mod" level="debug" additivity="false">
      <AppenderRef ref="SysOut"/>
      <AppenderRef ref="ServerGuiConsole"/>
    </Logger>
  </Loggers>
</Configuration>Then in the build.gradle, tell Loom to use our new configuration.
gradle
loom.log4jConfigs.from "log4j-dev.xml"Now, when we send debug log messages, we'll be able to see them in the console.
java
ExampleMod.LOGGER.debug("Debug logging is enabled");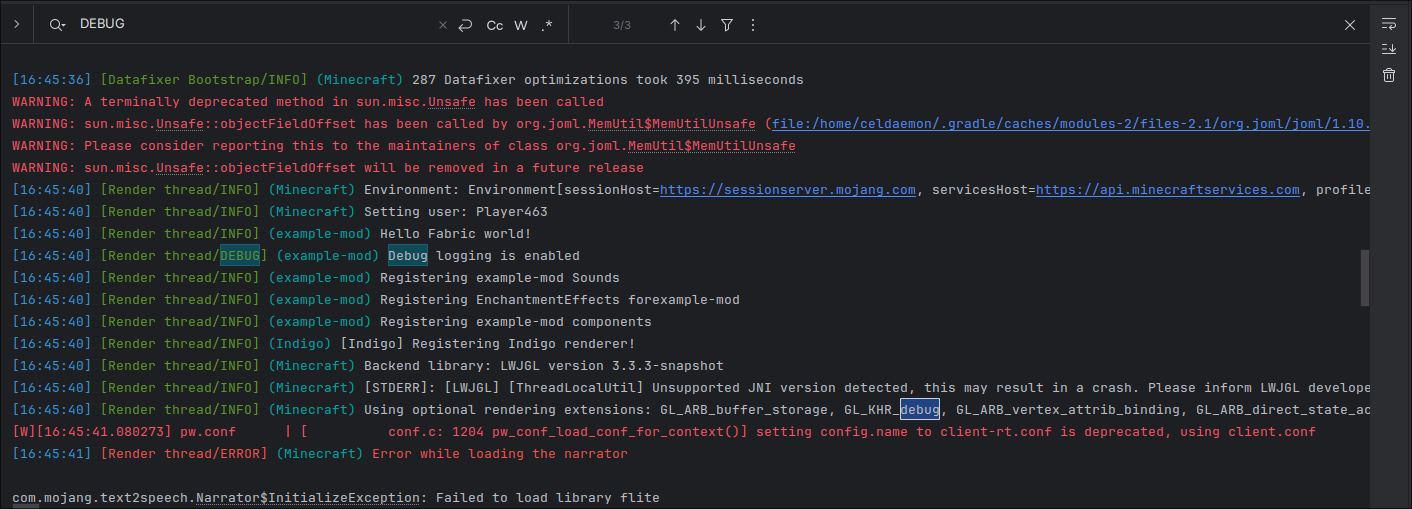
TIP
If debug messages are still not visible, your run configurations may be outdated. To fix this, regenerate them using the Gradle task for your IDE.
Locating Issues
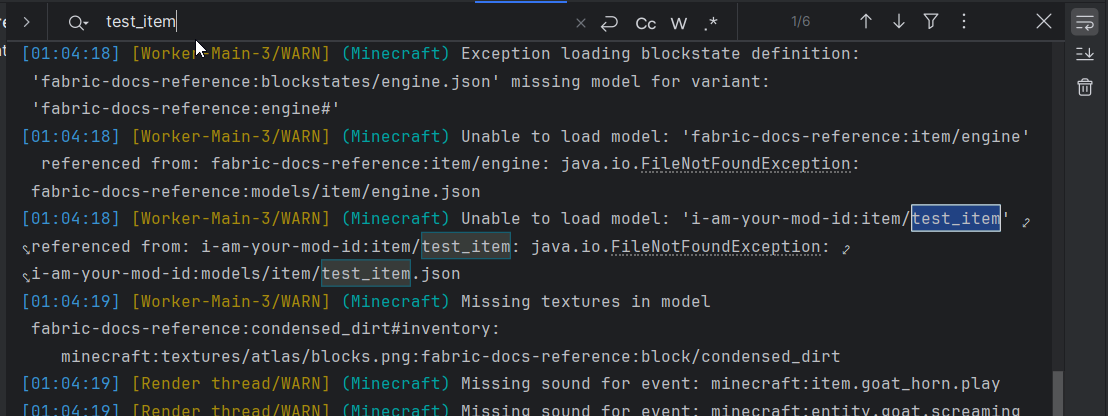
The logger prints your mod's ID in front of the line. You can search (⌘/CTRL+F) for it to highlight it.
Missing assets and textures (the Purple & Black placeholder) also log a warning to the console, and usually mention the expected values.

Breakpoints
A more sophisticated way of debugging is using breakpoints in an IDE. As their name suggests, they are used to halt the executed code at specific points to allow for inspecting and modifying the state of the software.
TIP
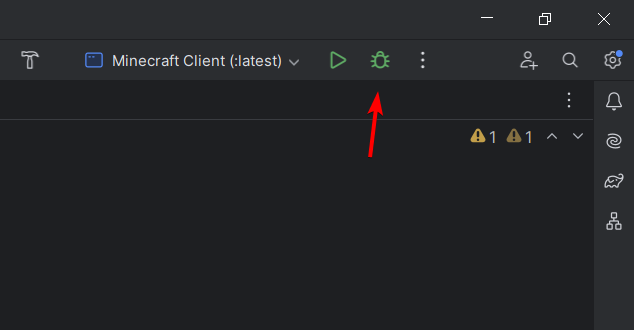
To use breakpoints, you must execute the instance using the Debug option instead of the Run option:
Let's use our custom item as an example again. The item's CUSTOM_NAME DataComponentType is supposed to change if it is used on any Stone block. However, in this example, the item always seems to trigger a "success" hand animation, yet cobblestone doesn't seem to change the name.
How can we resolve these two issues? Let's investigate...
java
// problematic example code:

public class TestItem extends Item {

    public TestItem(Properties properties) {
        super(properties);
    }

    @Override
    public InteractionResult useOn(UseOnContext context) {
        Level level = context.getLevel();
        Player user = context.getPlayer();
        BlockPos targetPos = context.getBlockPos();
        ItemStack itemStack = context.getItemInHand();
        BlockState state = level.getBlockState(targetPos);

        if (state.is(ConventionalBlockTags.STONES)) {
            Component newName = Component.literal("[").append(state.getBlock().getName()).append(Component.literal("]"));
            itemStack.set(DataComponents.CUSTOM_NAME, newName);
            if (user != null) {
                user.displayClientMessage(Component.literal("Changed Item Name"), true);
            }
        }

        return InteractionResult.SUCCESS;
    }
}Place a breakpoint by clicking on the line number. You can place more than one at once if needed. The breakpoint will stop right before executing the selected line.
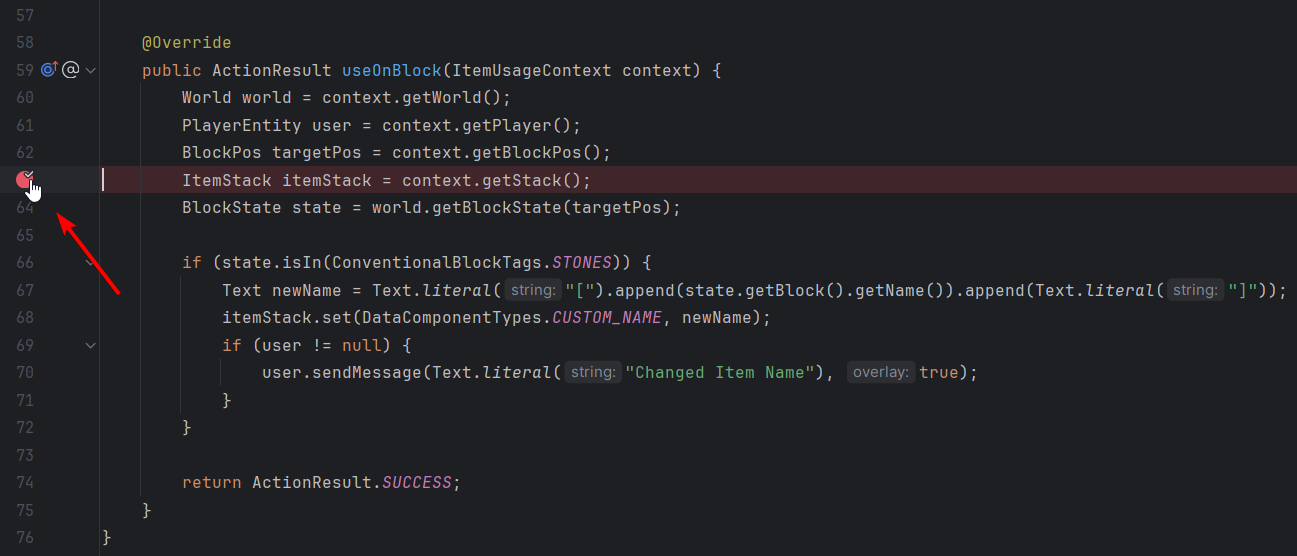
Then let the running Minecraft instance execute this part of the code. You can place breakpoints while the game is running, too.
In this case, the custom item needs to be used on a block. The Minecraft window should freeze, and in IntelliJ a yellow arrow will appear right next to the breakpoint, indicating that the debugger has reached that point.
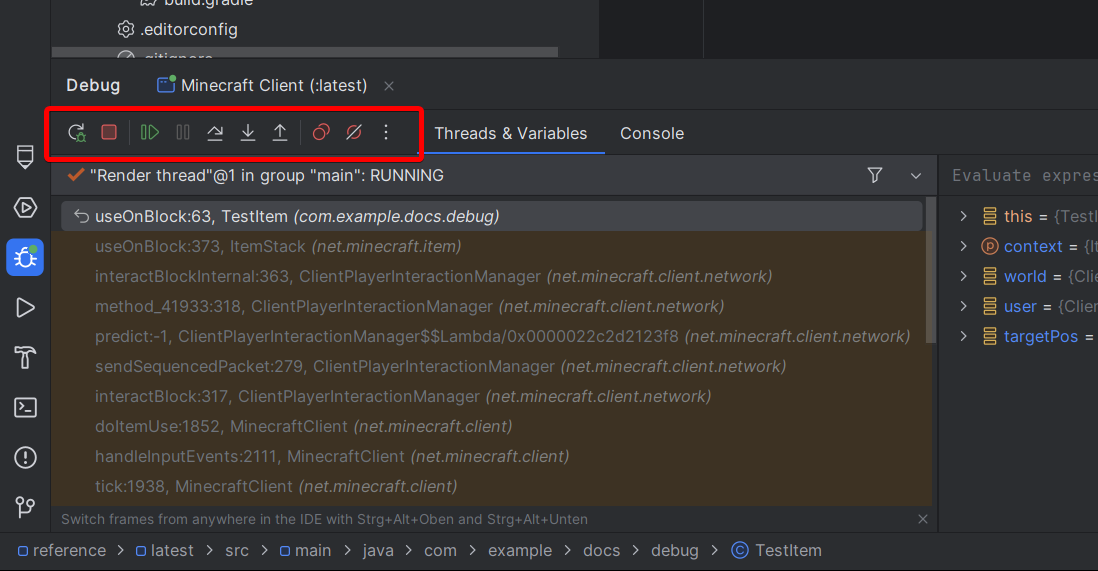
At the bottom, a Debug window should open, and the Threads & Variables view should be selected automatically. You can use the arrow controls in the Debug window to move the execution point. This way of moving through the code is called "stepping".
| Action | Description |
|---|---|
| Step Over | Steps to the next executed line, basically moving the instance along in the logic |
| Step Into | Steps into a method to show what is happening inside. If there are multiple methods on one line, you can choose which to step into by clicking it. This is also necessary for lambdas. |
| Run To Cursor | Steps through the logic until it reaches your cursor in the code. This is useful for skipping large chunks of code. |
| Show Execution Point | Moves the view of your coding window to the point where the debugger is currently at. This also works if you are currently working in other files and tabs. |
INFO
The "Step Over" F8 and "Step Into" F7 actions are the most common ones, so try to get used to the shortcuts!
If you are done with the current inspection, you can press the green Resume Program button (F9). This will unfreeze the Minecraft instance, and further testing can be done until another breakpoint is hit. But let's keep looking at the Debug window for now.
On the top, you can see all currently running instances. If both are running, you can switch between the client and the server instance. Below that, you have the debug actions and controls. You can also switch to the Console view if you need to take a look at the logs.
On the left side, you can see the currently active thread, and the stack trace below that.
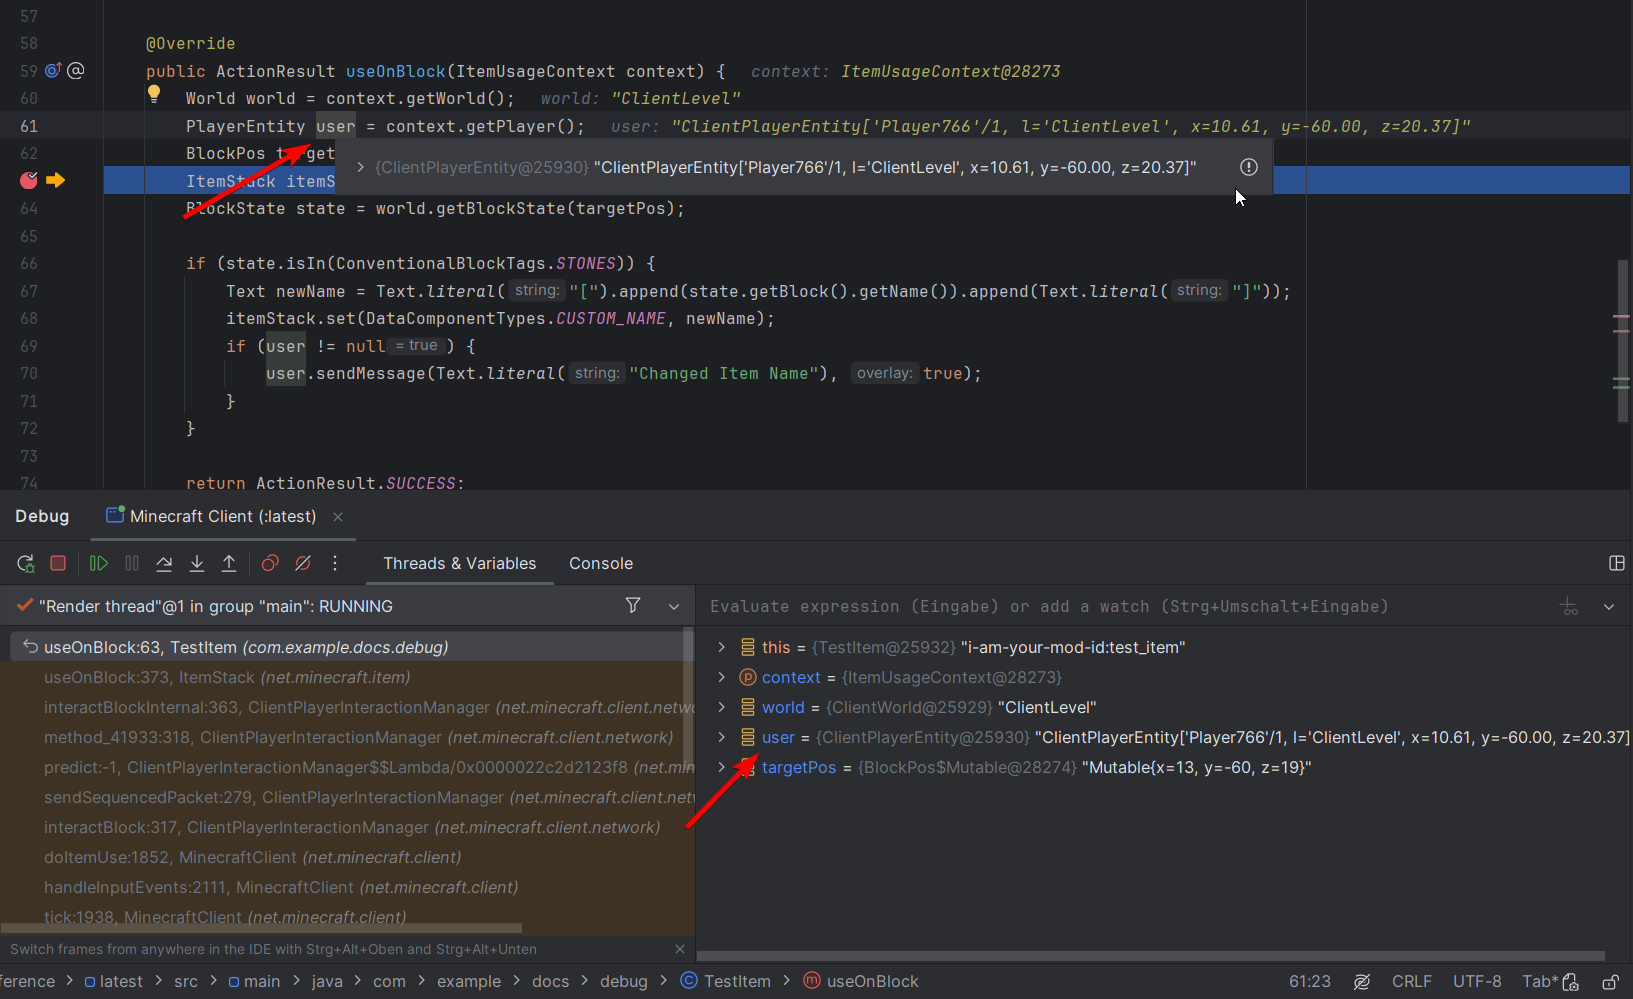
On the right side, you can inspect and manipulate loaded values and objects. You can also hover over the values in the code: if they are in scope and are still loaded, a pop-up window will show their specific values too.
If you are interested in the content of a specific object, you can use the small arrow icon next to it. This will unfold all nested data.
Values are obviously not loaded if the execution point didn't pass by them or if they are located in a completely different context.
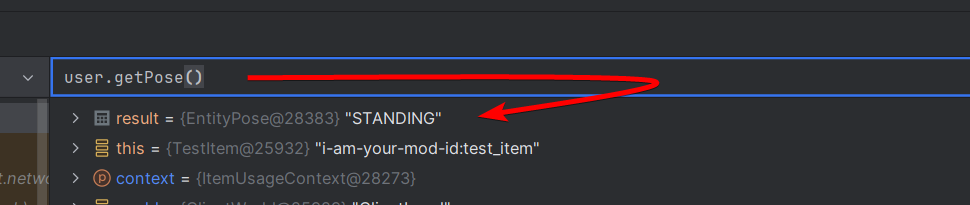
You can use the input line in the Debug window for many different things, for example you can access currently loaded objects and use methods on them. This will add a new entry below, showing the requested data.
Let's step over in our example, so that the BlockState variable is loaded. We can now check if the BlockState of the targeted block is actually in the Block tag.
TIP
Press the + icon on the right side of the input line to pin the result for the current debug session.
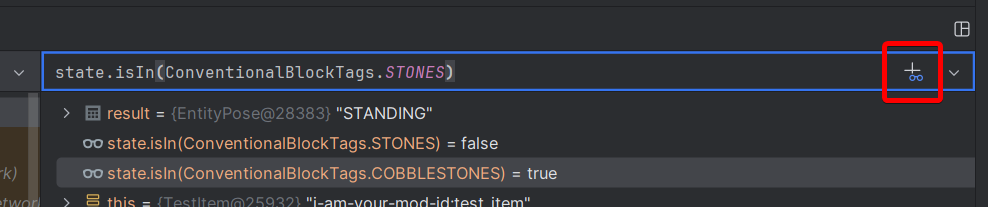
As we can see, the ConventionalBlockTags.STONES tag does not include cobblestone because there is a separate tag for that.
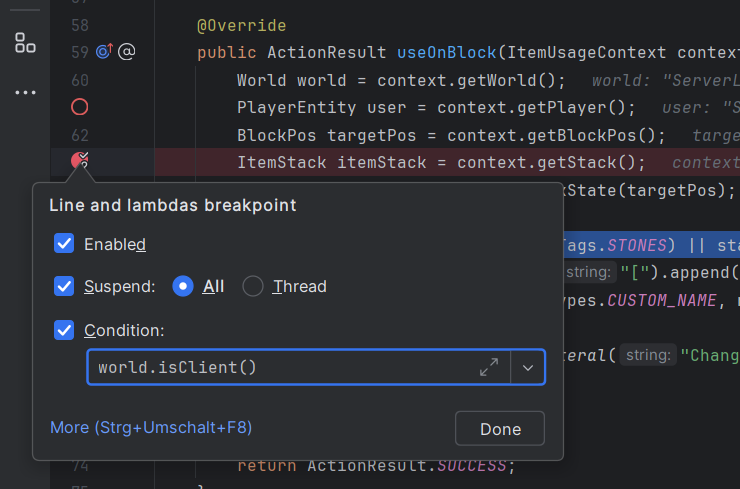
Breakpoint Toggle and Conditions
Sometimes you only need to halt code when certain conditions are met. For that, create a breakpoint and right-click it to open its settings. In there you can set a boolean statement as the condition.
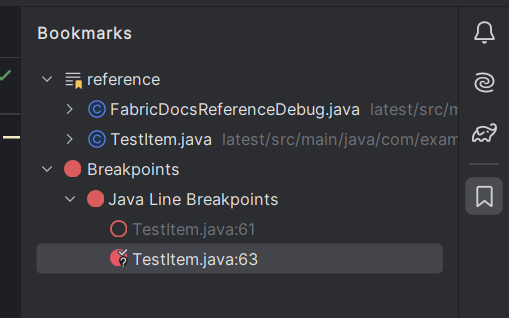
Hollow breakpoint icons indicate inactive breakpoints, which won't halt the active Minecraft instance. You can toggle breakpoints either in the breakpoint's settings pop-up window or simply by middle-clicking the breakpoint itself.
All breakpoints will be listed in IntelliJ's Bookmarks window.
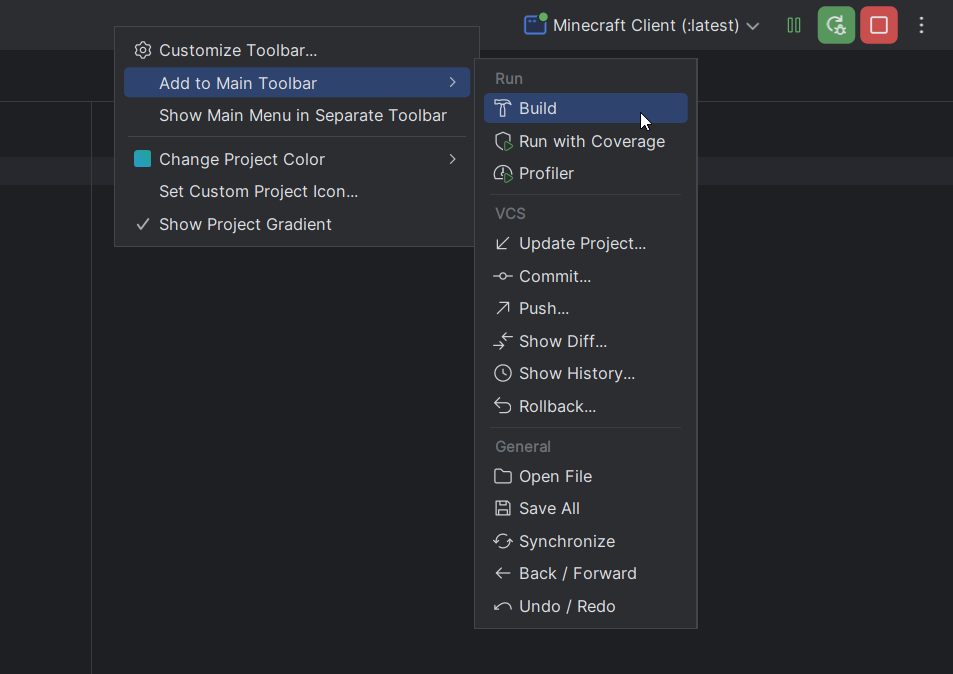
Hotswapping An Active Instance
You can make limited changes to the code while an instance is running, using the Build > Build Project action with the hammer icon. You can also put the icon next to the Run Configuration drop-down element by right-clicking the empty space on IntelliJ's top menu bar.
This process, also called "hotswapping", requires the Minecraft instance to be started in Debug mode instead of the Run mode (see above).
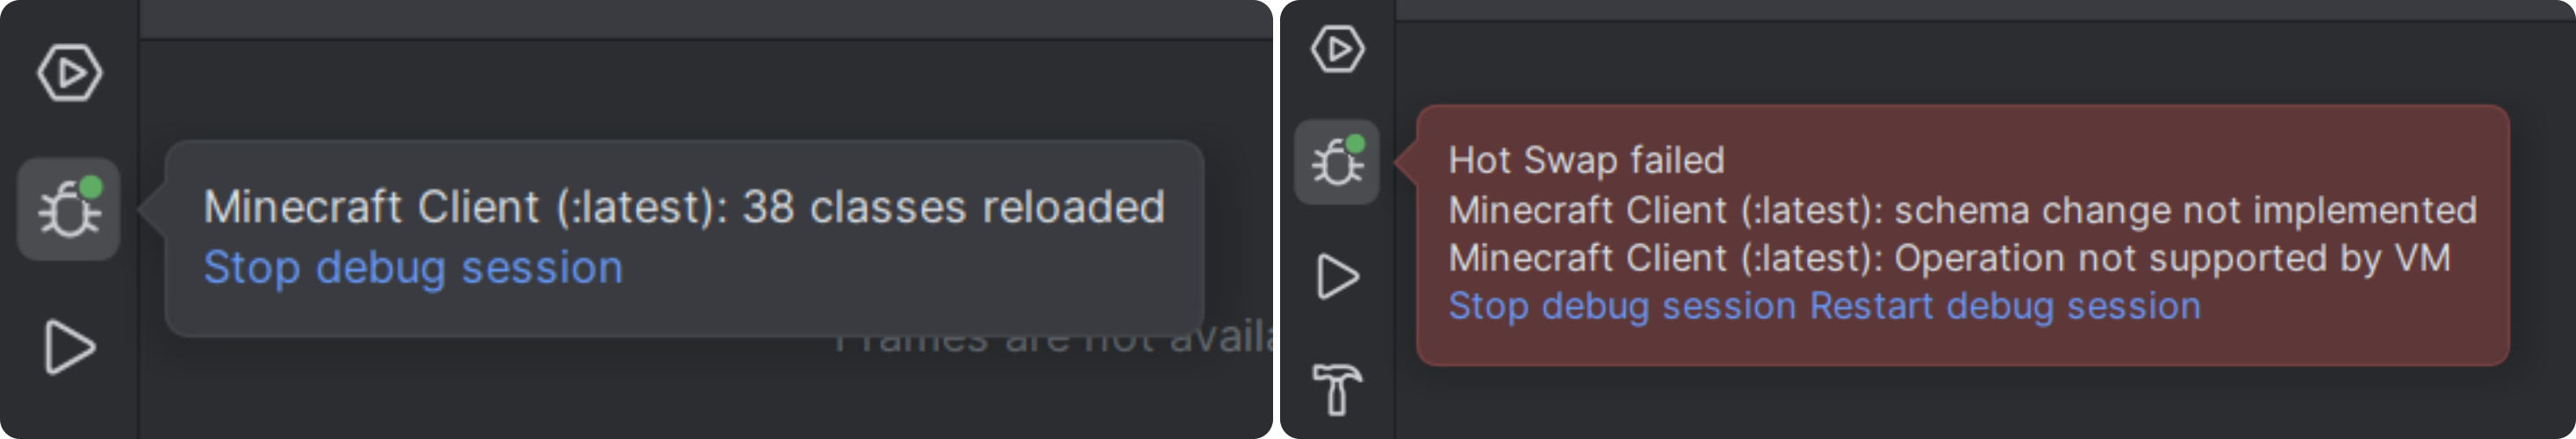
With this, you don't need to restart the Minecraft instance again. It also makes testing screen element alignment and other feature balancing faster. IntelliJ will notify you if the "hotswap" was successful.
Mixins are an exception. You can set up your Run Configuration to allow them to change at runtime too. For more information, check out Hotswapping Mixins.
Other changes can be reloaded in-game.
- changes to the
assets/folder -> press F3+T - changes to the
data/folder -> use the/reloadcommand
To finish up with the example from earlier, let's add a condition to the statement. Once we hit the breakpoint, we can see that we always get a "success" hand animation because we never returned anything else.
Apply the fixes and use hotswapping to see the changes in the game instantly.
java
@Override
public InteractionResult useOn(UseOnContext context) {
	Level level = context.getLevel();
	Player user = context.getPlayer();
	BlockPos targetPos = context.getClickedPos();
	ItemStack itemStack = context.getItemInHand();
	BlockState state = level.getBlockState(targetPos);

	if (state.is(ConventionalBlockTags.STONES) || state.is(ConventionalBlockTags.COBBLESTONES)) {
		Component newName = Component.literal("[").append(state.getBlock().getName()).append(Component.literal("]"));
		itemStack.set(DataComponents.CUSTOM_NAME, newName);

		if (user != null) {
			user.sendOverlayMessage(Component.literal("Changed Item Name"));
		}

		return InteractionResult.SUCCESS;
	}

	return InteractionResult.PASS;
}Logs And Crashes
Consoles of previously executed instances are exported as log files, located in the Minecraft instance's logs directory. The newest log is usually called latest.log.
Users will be able to share this file with the mod's developer for further inspection, as explained in Uploading Logs.
In the development environment, you can find previous logs in the Project window's run > logs folder, and crash reports in the run > crash-reports folder.
Ask The Community!
Still couldn't figure out what's going on? You can join the Fabric Discord Server and have a chat with the community!
You may also want to check out the Official Fabric Wiki for more advanced queries.